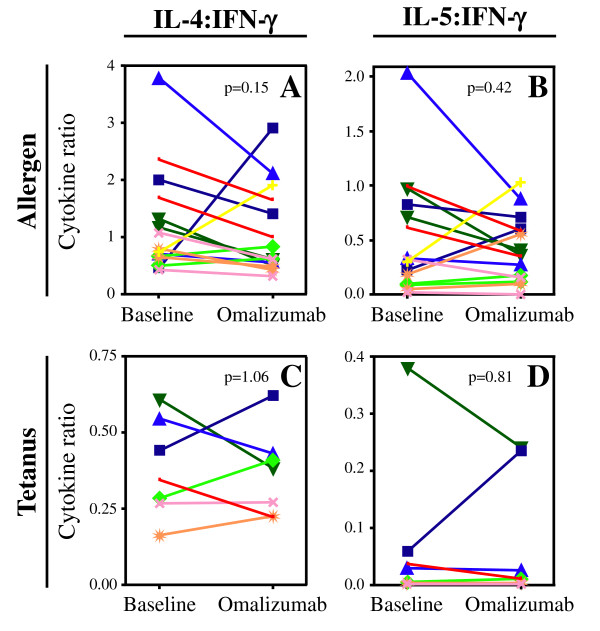
Figure 4.
Effect of anti-IgE therapy on allergen specific T cell cytokines. The ratio of IL-4:IFN-γ (A, C) and IL-5:IFN-γ (B, D) producing cells were measured in cultures stimulated with either allergen (A, B) or tetanus toxoid (C, D), and compared at baseline and at study completion. Each color/symbol combination represents one subject and one allergen; results in A and B include two allergens examined for each subject.

