
Fig. 8.
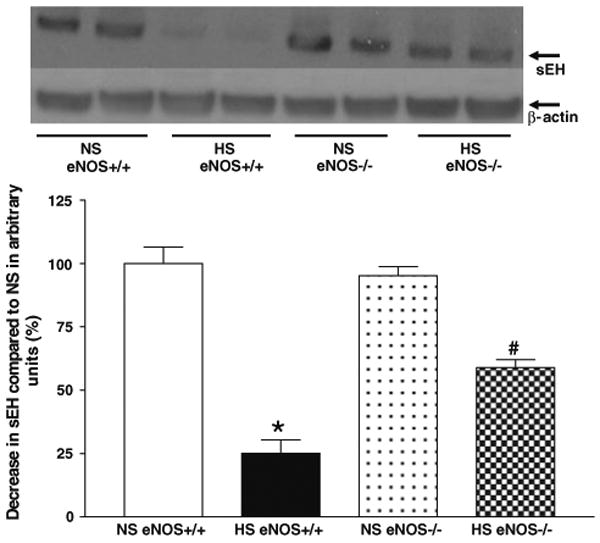
Representative western blots and densitometric data for sEH protein in aortas of eNOS+/+ and eNOS−/− mice fed with HS and NS containing diets. Values are mean ± SEM, *#P < 0.05 compared NS (eNOS+/+, eNOS−/−) aortas with *HS (eNOS+/+) and #HS (eNOS−/−), n = 5