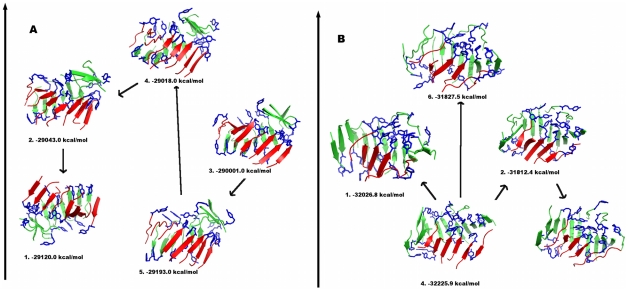
Figure 10. Representative structures of the most populated clusters from all-atom REMD simulations of the 20mer: (a) structure 20GRp-B3 and (b) structure 20OP2-N.
The number identifying each structure represents the cluster rank (1. being the most populated cluster). The value of the GB/SA energy in water of the complex is reported. Arrows represent transitions between clusters, indicating possible paths between cluster structures.

