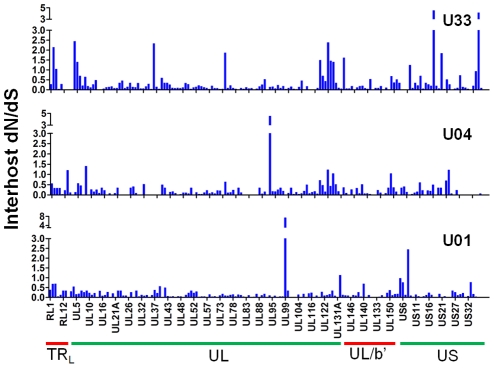
Figure 7. A majority of ORFs appeared to be under negative selection based on interhost dN/dS values.
Interhost dN/dS were plotted for each ORF of the HCMV genome based on high throughput sequence data of clinical samples from three patients: U01, U04, and U33. The ORFs are listed in layout of the standard HCMV genome from left to right. See Table S6 for a tabular representation of these data. Due to space constraints, not all ORFs are named on the plot. The major divisions of the HCMV genome are shown below the graph.

