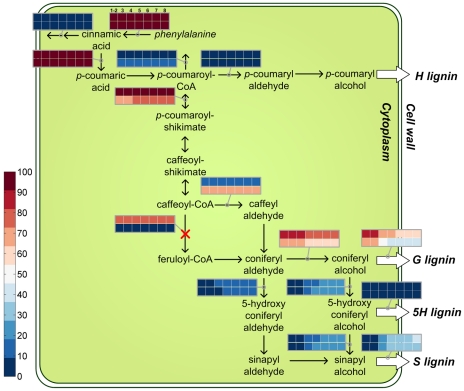
Figure 3. Developmental evolution of the steady-state flux distribution in CCoAOMT-deficient plants versus the wild-type plants.
The reaction crossed out in red is dysfunctional in this particular transgenic strain. Two rows of colored boxes are placed either above horizontally plotted fluxes, or to the left of vertically plotted fluxes. The first row represents wild-type plants, whereas the second row refers to transgenic line (here a CCoAOMT-deficient plant). Each row contains seven colored boxes, which represent the seven stem internodes (with internodes 1 and 2 merged). In FBA and MOMA, all fluxes are normalized to the initial step in the pathway, namely the conversion of phenylalanine to cinnamic acid. Therefore, the color of each box shows the normalized steady-state value of the corresponding flux in one specific internode: low values are dark blue, intermediate values are white, and high values are dark red. Because all the reactions along a linear pathway have the same flux values at steady state, only the first one is shown.

