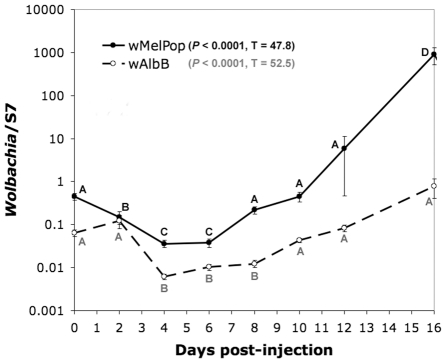
Figure 2. Changes in titer of wMelPop and wAlbB in An. gambiae after microinjection, assessed by quantitative PCR.
Values are expressed as a ratio of Wolbachia genomes to host genomes. Kruskal-Wallis statistics are shown in the legend. Wolbachia strains were not statistically compared to one another. Within treatments, time points with the same letter do not differ statistically.

