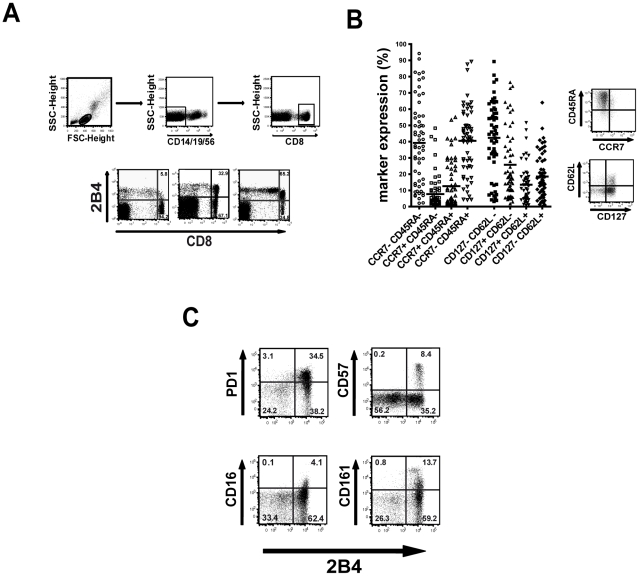
Figure 2. Characteristics of 2B4+ CD8+ T cells.
(A) For analysis of the phenotype of 2B4+ CD8+ T cells were gated as demonstrated on live cells and after exclusion of CD14/CD19/CD56+ cells (upper panel). Exemplary staining of 2B4 expression on CD8+ T cells in healthy individuals is shown in the lower panel. (B) The maturation status of 2B4+CD8+ T cells was analyzed by costaining with CCR7, CD45RA, CD62L and CD127. The frequencies of expression of these markers are shown in the left Figure. Expression showed a high inter-individual variability (CCR7+ CD45RA-: mean 40.5% ±20.9%;CCR7+ CD45RA+: mean 12.6%±14.8%; CCR7- CD45RA+: mean 7.7% ±10.6%; CCR7- Cd45RA-: mean 39.2±25.7; CD62L+ CD127-: mean 25.7% ±20.8%; CD62L+ CD127+: mean 13.4% ±11.4%; CD62L- CD127+: mean 18.5% ±13.9%; CD62L- CD127-: mean 42.3% ±22.3%) and expression of 2B4 on CD8+ T cells could not be linked to a specific memory population subtype. Representative FACS plots are shown on the right side. Cells were gated on CD14/CD19/CD56-negative cells and 2B4+CD8+ T cells. (C) Coexpression of 2B4 with the coinhibitory molecule PD1, CD57, CD16 and CD161. Cells were stained for 2B4 together with PD1, CD57, CD16 or CD161, plots are gated on CD14/CD19/CD56-negative lymphocytes. All CD8+ T positive for either PD1, CD57, CD16 or CD161 were found to simultaneously be also positive for 2B4 as shown in the representative FACS plots.

