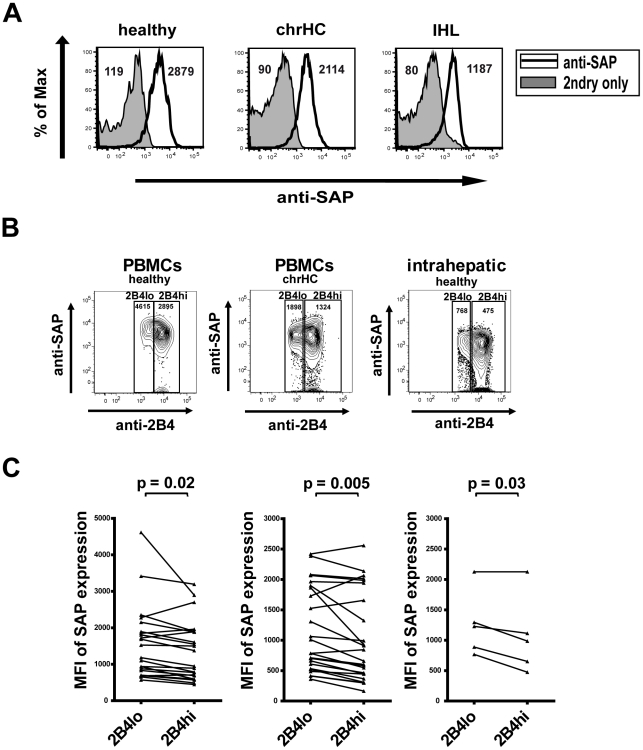
Figure 5. Expression of SAP by CD8+ T cells.
Intracellular staining for the 2B4 adaptor molecule SLAM-associated protein (SAP) was performed. (A) Representative overlays of histograms for SAP staining (solid line) and respective 2ndry antibody only (tinted graphs) of peripheral CD8+ T cells from healthy individuals (upper left), chronic hepatitis C patients (upper right) and isolated intrahepatic CD8+ T cells (lower left) are shown. MFI values for both histograms are indicated. (B) Intracellular SAP content of CD8+ T cells differs with expression intensity of 2B4. Peripheral blood CD8+ T cells from healthy individuals (left plot) and chronic hepatitis C patients (middle plot) and intrahepatic CD8+ T cells (right plot) were stained for 2B4 and intracellular SAP. Cells were gated according to 2B4 expression levels into 2B4lo and 2B4hi cells as shown and content of intracellular SAP was determined by calculating the SAP MFI as indicated. SAP content was found to be lower in cells with high as compared to cells with low 2B4 expression levels. (C) Intracellular SAP staining of 2B4+ CD8+ T cells showed a significantly lower SAP expression intensity high 2B4 expression (2B4hi) as compared to cells with low 2B4 expression (2B4lo) in healthy volunteers (left plot; p = 0.02), patients with chronic hepatitis C (middle plot; p = 0.005) and intrahepatic cells (right plot; p = 0.03).

