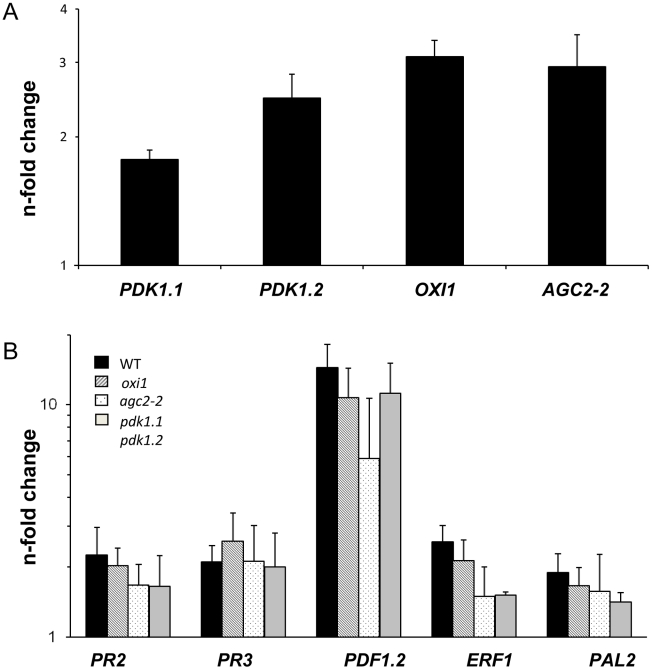
Figure 6. Expression levels of PDK1, OXI1 and AGC2-2 genes and defense genes after treatment with a high dosis of P. indica (for details, cf. Methods and Materials and Figure S4A,B in Text S1).
Panel A shows PDK1, OXI1 and AGC2-2 expression levels and panel B shows expression levels of several defense genes. RNA was extracted from roots and real-time PCR analyses were performed with the housekeeping gene GAPC2 as control. Calculations were performed according to [63]. Bars show fold-induction of RNA values from wild type and agc mutant roots 7 days after co-cultivation on a fungal lawn relative to the RNA levels from seedlings grown in the absence of the fungus. Bars show the mean out of at least three independent experiments with SEs. Data are presented on a log scale.

