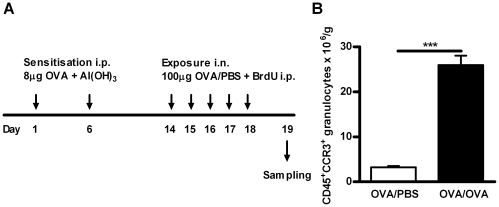
Figure 1. Establishment of allergic airway inflammation.
A) Schedule of OVA sensitisation (i.p.), OVA exposure (25 µl intranasal instillation: i.n.), BrdU administration (1 mg i.p.) and tissue sampling in this model of allergic airway inflammation. All animals were sensitised to allergen, but control animals were exposed to PBS instead of OVA. B) Number of lung tissue CD45+ CCR3+ granulocytes (i.e. eosinophils) per gram of tissue after OVA/PBS or OVA/OVA exposure, Data is shown as mean ± SEM, n = 5–8 mice/group, ***, p<0.001.

