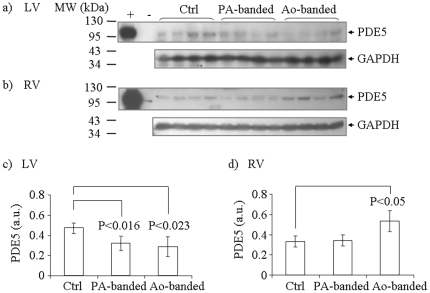
Figure 5. Determination of PDE5 expression in feline hypertrophy models.
Tissue homogenates from LV and RV of control, PA-banded and Ao-banded animal models were analyzed for PDE5 expression by immunoblotting. (a) Homogenates from LV samples. (b) Homogenate from RV samples. Samples from control, PA-banded and Ao-banded groups were indicated in the figure. E. coli extracts from strains carrying pT7-PDE5 and pSNAP-tag(T7) were used as positive and negative controls (shown as+and -). GAPDH levels in the same set of tissue samples were also determined by immunoblotting, and used for normalization of PDE5 levels. (c) Normalized average PDE level in LV tissues from each group (n = 4). (d) Normalized average PDE level in RV tissues from each group. The error bars indicate standard deviations. Student t-test p values that show statistical significance are indicated in the figure.

