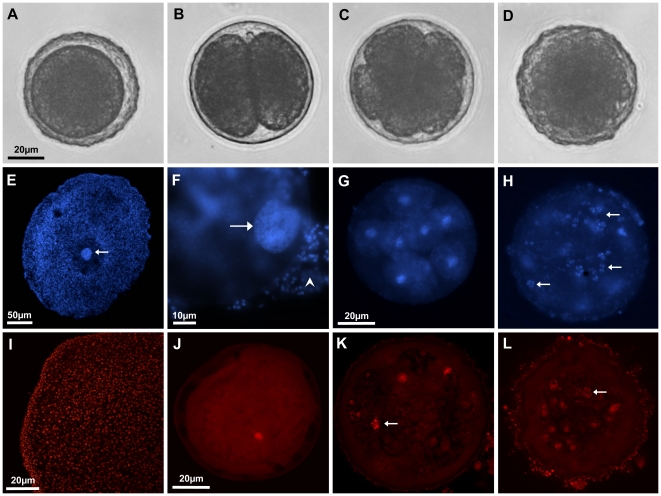
Figure 2. Cell counting in Placozoa sp. H2 embryos.
Shown are embryos at the zygote-, 2-cell, 8-cell and 64-cell stage inside the fertilization membrane under light microscopy (A–D). Cleavage is total and equal. Nuclear staining with DAPI shows a direct correlation of blastomer number and fluorescent signals under standard fluorescent microscopy (F–H; 1, 8 and 64 cells, respectively). The same was seen with propidium iodide staining in confocal laser scanning images (J–L; 1, 8 and 120 cells, respectively). Red signals at the surface of the fertilization membrane in K and L derive from attached bacteria and algae to the fertilization membrane of the free drifting embryos. Positive controls for the staining procedure with adult animals showed clear nuclear signals for both fluorescent dyes (E, I). Maturing oocytes and zygotes show a large nucleus compared to somatic cells of the mother animal (arrow in E; F). (F) shows a zygote with a large, regular shaped interphase nucleus (arrow). Note that cells from the mother animal are still attached to the embryo (arrowhead). Metaphase chromosome clumps were regularly found in fluorescent staining, indicating normal cell cycle (arrow in H, K and L; compare Figure 3d2). The scale bars of A, G and J also apply to B–D, H and K–L, respectively.

