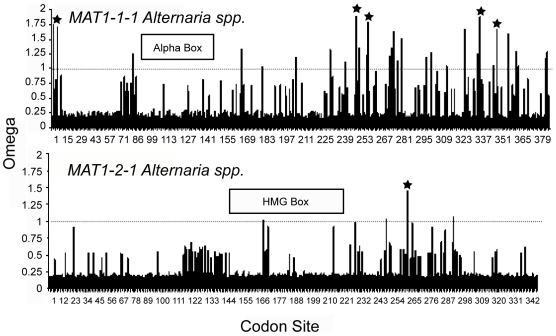
Figure 1. Non-synonymous to synonymous substitution ratio (ω) for MAT1-1-1 (upper) and MAT1-2-1 (lower) in Alternaria estimated in CODEML in PAML.
The graph shows approximate posterior means of ω calculated as an average of ω's weighted by their posterior probabilities of the 11 site classes using in model 8a. The 11 ω ratios for MAT1-1-1 are 0.08896, 0.10488, 0.11513, 0.12372, 0.13175, 0.13979, 0.14838, 0.15827, 0.17113, 0.19391, and ωs = 1.46207. The 11 ω ratios for MAT1-2-1 are 0.08585, 0.12609, 0.15474, 0.18009, 0.20463, 0.22990, 0.25745, 0.28968, 0.33196, 0.40659, and ωs = 2.22313. Sites with low mean ω are inferred to be under purifying selection. Asterisks indicate sites with posterior probabilities more than 0.80 for ωs>1.

