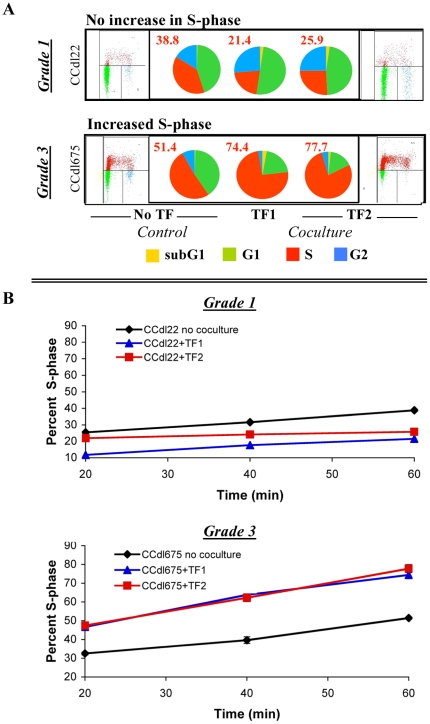
Figure 3. Influence of stromal-epithelial crosstalk on proliferation rate of tumor cells of varying histologic grade.
A. Cell cycle analysis of primary breast tumor cell lines in coculture with 2 independent fibroblast samples, TF1, and TF2. Pie charts summarize FACS data. Numbers denote percent cells in the S-phase of the cell cycle. Each value is the average of triplicate data points. Representative FACS dot plots are shown for control (left of corresponding pie chart) and TF2-cocultured cells (right of corresponding pie chart). Note varying effects of stromal coculture on tumor cell cycling. B. Measurement of S-phase kinetics over time in representative grade 1 and grade 3 cell lines in the presence of TF1 and TF2 cells. Note contrasting effects of stromal cells on the replication rate of cell lines shown. Error bars represent standard deviation of the average of triplicate values. Fibroblast-induced decrease in BrdU labeled cells in grade 1 tumor cells, and a corresponding increase in grade 3 tumor cells was significant at all time points (p<0.005, and p<0.001, respectively).

