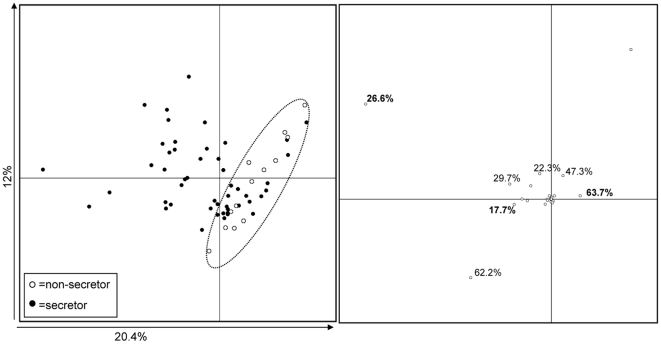
Figure 2. PCA plot based on the bifidobacterial DGGE profiles of faecal samples from the non-secretor (open circles) and secretor (closed circles) individuals (A) and DGGE bands contributing to the principal components 1 and 2 (B).
In panel B, the numbers in bold indicate the band positions, which were significantly less commonly (Fisher's exact test, p<0.01) detected in the non-secretor individuals than in the secretor individuals (See Table 4).

