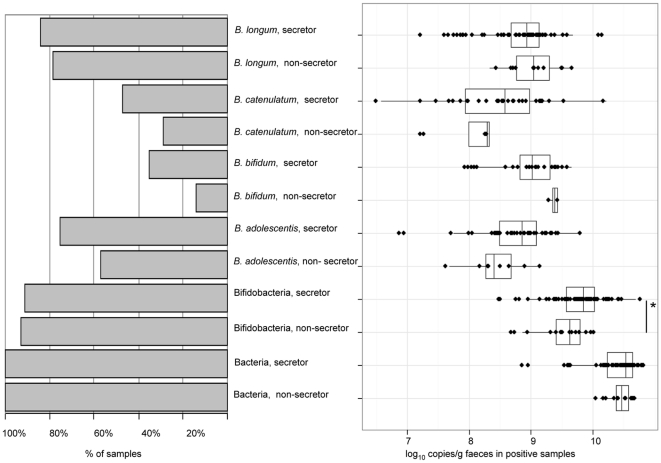
Figure 4. Incidence (% of samples) (left) and Box-and-Whisker plots (right) (based on log10 16S rRNA gene copies per g faeces) of total bacteria, bifidobacteria and bifidobacterial groups in the faecal samples of the non-secretor and secretor individuals by qPCR.
A significant difference by Wilcoxon test: * p<0.05. In addition, a trend (p = 0.06) towards higher number of the 16S rRNA gene copies of B. adolescentis in the secretor individuals than in the non-secretor individuals was detected.

