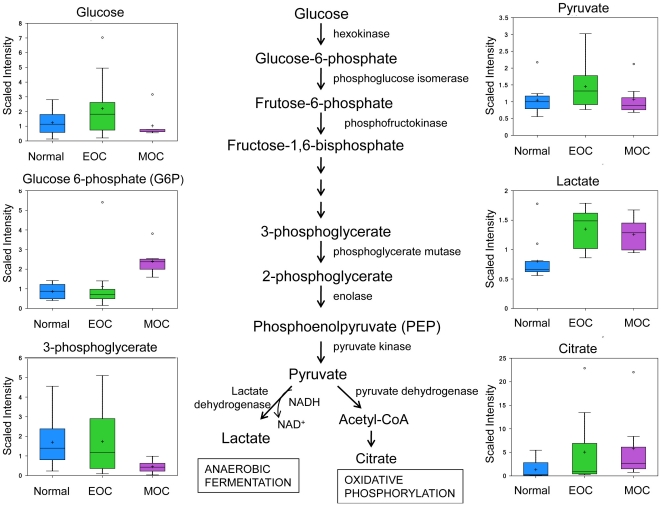
Figure 3. The glycolytic pathway converting glucose to pyruvate for anaerobic fermation to produce lactate or aerobic respiration of the citric acid for oxidative phosphorylation.
Glucose, glucose-6-phosphate, fructose-6-phosphate, 3-phosphoglycerate, phosphoenolpyruvate (PEP), pyruvate, lactate, and citrate analyzed by GC/MS. Box legend: + inside box represents mean value, bar inside box represents median value, upper bar represents maximum of distribution, lower bar represents minimum of distribution, circle represents extreme data points.

