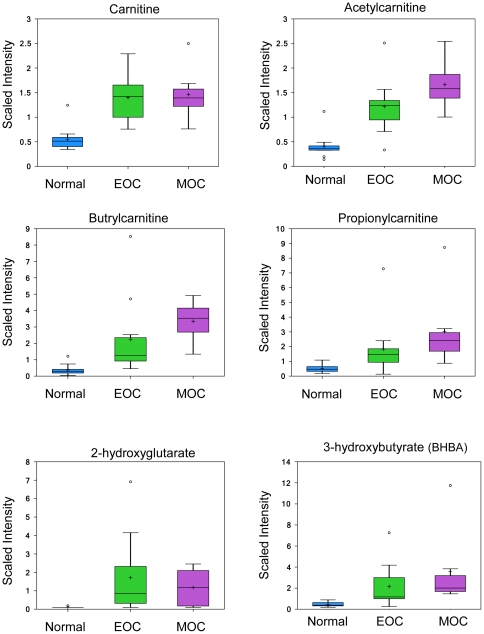
Figure 5. Carnitine and fatty acid metabolites.
Carnitine, acetylcarnitine, butrylcarnitine, and propionylcarnitine analyzed by LC/MS positive ion spray. 2-hydroxyglutarate and 3-hydroxybutyrate analyzed by GC/MS. Box legend: + inside box represents mean value, bar inside box represents median value, upper bar represents maximum of distribution, lower bar represents minimum of distribution, circle represents extreme data points.

