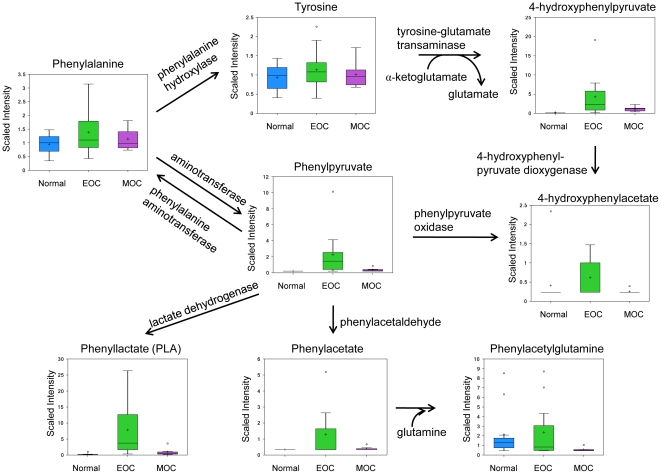
Figure 6. Phenylalanine metabolic pathway.
Phenylalanine and tyrosine analyzed by LC/MS pos.; phenylpyruvate, phenyllacetate, phenylacetylglutamine, phenylactate, and 4-hydroxyphenylpyruvate via LC/MS negative ion spray; 4-hydroxyphenylacetate via GC/MS. Box legend: + inside box represents mean value, bar inside box represents median value, upper bar represents maximum of distribution, lower bar represents minimum of distribution, circle represents extreme data points.

