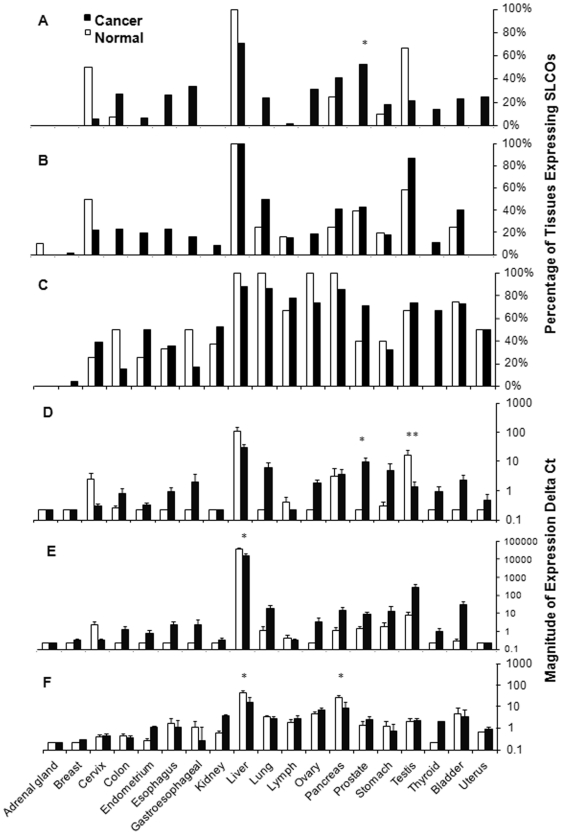
Figure 1. Expression profile of SLCOs in normal and neoplastic tissues.
Data are first expressed as a percentage of tissues with mRNA expression of A) SLCO1B3 B) SLCO1B1, and C) SLCO2B1, and then as the magnitude of normalized mRNA expression of D) SLCO1B3, E) SLCO1B1, and F) SLCO2B1. * - P<0.05, ** - P<0.01 for Fisher's Exact and Wilcoxon Rank Sum Tests respectively.

