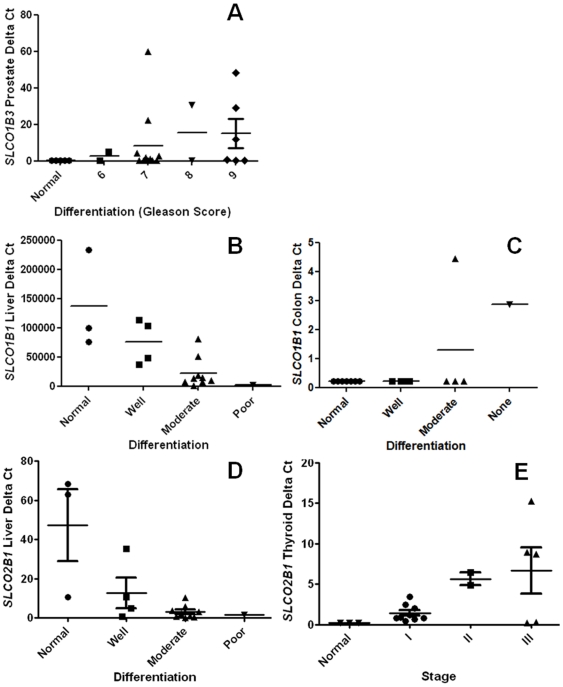
Figure 2. SLCO mRNA expression correlates to differentiation in cancer.
SLCO1B3 mRNA expression by differentiation in A) prostate P = 0.03. SLCO1B1 expression in B) liver P = 0.0004, C) colon P = 0.05. SLCO1B2 expression in D) liver P = 0.005. E) SLCO2B1 expression by stage in thyroid P = 0.04. All were found as signifcant correlations by the Jonckheere-Terpstra trend test.

