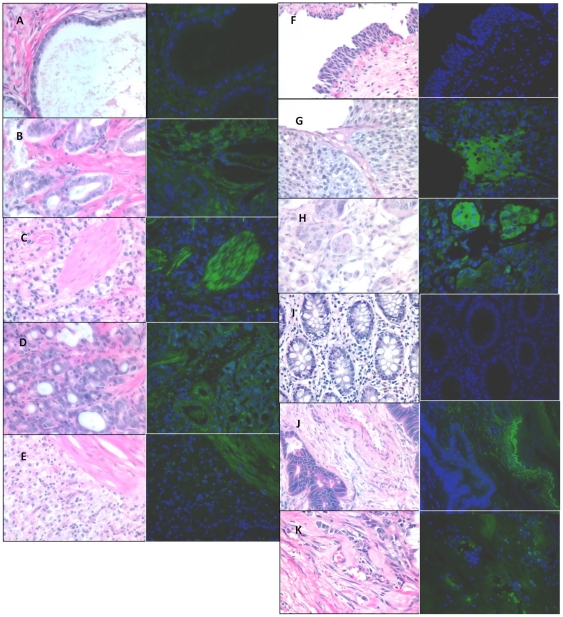
Figure 3. Tissue staining of OATP1B3 expression in cancer.
Concurrent tissue sections stained with hematoxylin and eosin (left panel) and immunofluoresence (right panel) for OATP1B3. OATP1B3 is detected with FITC, in green, and nuclei are stained with DAPI, in blue. Prostate tissues comprising, BPH, and tumors of varying grade are reported as follows: A) benign prostatic hyperplasia, B) gleason 6, C) gleason 7, D) gleason 8, E) gleason 9. Bladder tissue sections are derived from F) normal bladder, G) grade II, H) grade III bladder tumors. Finally, colon tissue from I) normal colon, J) grade II (10x magnification), K) grade III colon tumors are disclosed. All photos were taken at 40x magnification unless otherwise noted.

