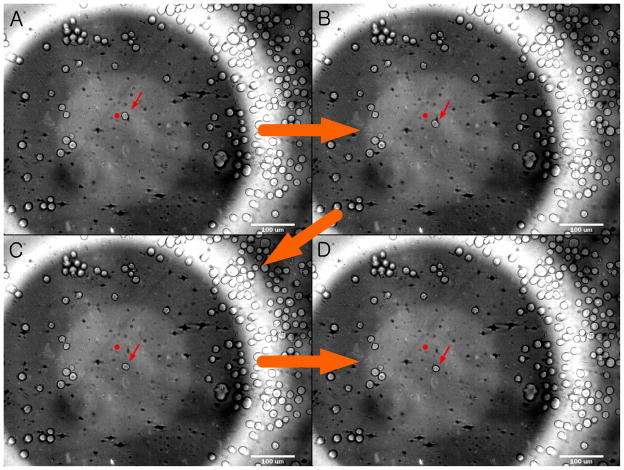
Figure 6.
Example of cell motion within acoustic trap (×10 objective). The cell location was recorded every 3 seconds. (A) The cell (see an arrow in the middle) is initially positioned at 50 μm from the trap center and (B) immediately directed to it when the transducer is excited. (C) After migrating over the focal plane, (D) the cell becomes finally settled at the focus. A dot is given as a reference point to show the change in the cell location.

