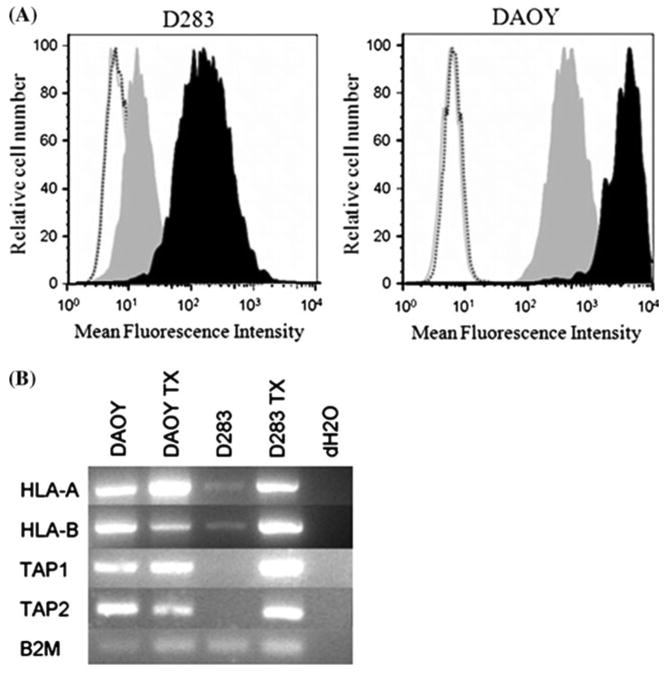
Fig. 4.

Upregulation of MHC class I by IFNγ treatment. Cells were incubated with media alone or supplemented with 100 U/ml IFNγ for 72 h at 37°C. a Induction of MHC class I was evaluated by flow cytometry using the W6/32 antibody. The shaded gray curve represents levels of MHC class I prior to IFNγ treatment. Shaded black curve represents the levels of MHC class I following IFNγ treatment. Controls include unstained cells (gray solid line) and secondary only (black dashed line). b RT-PCR using the heavy chain, TAP1, TAP2 and β2m primers for MHC class I machinery confirmed induction of MHC class I components
