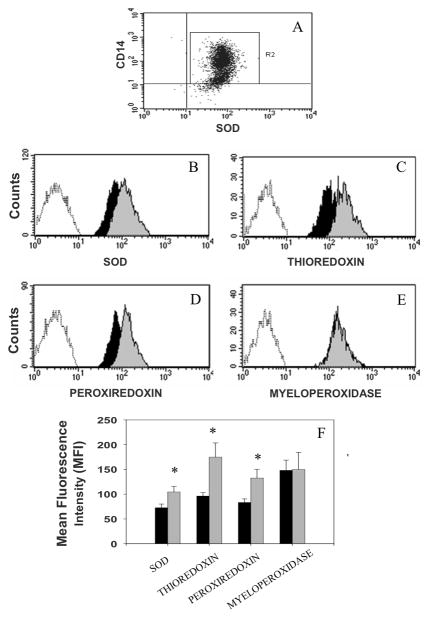
Figure 2. Intracellular expression of antioxidants in human monocytes.
Monocytes gated by side scatter vs. forward scatter dot plots were identified using a CD14 monoclonal antibody (FL2 channel) and antioxidants (e.g., SOD) monoclonal antibodies (FL1 channel) (Panel A). Representative histograms of intracellular antioxidants expression show significant differences in fluorescence intensities from normal cognition (grey histogram) and HAD (dark histogram) on the expression of SOD-1 (panel B), thioredoxin (panel C), and peroxiredoxin (panel D; p<0.05), but not on myeloperoxidase (panel E). A graphic representation of these differences in normal cognition (grey bars) and HAD (dark bars) is represented in panel F. The expression of these proteins in monocytes is represented by comparison with the non-fluorescent monocytes (unshaded histograms to the left in panels B to E).

