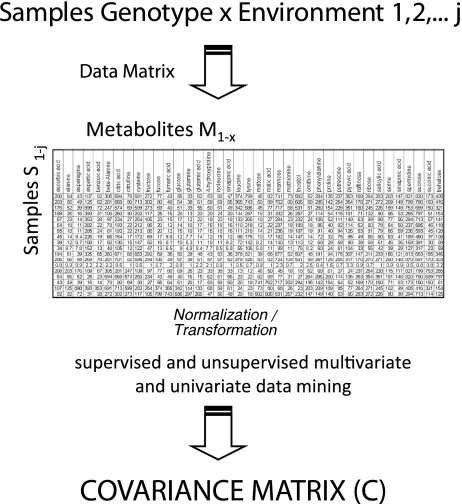
Fig. 5.
Chemometric workflow for the analysis of ultracomplex metabolome datasets. A multitude of samples are analysed and the complete set of samples versus detected, and quantified metabolites are assembled into a data matrix. Subsequently, the data are analysed by classic multivariate statistical tools (for more details, see [60]). The backbone of many of these supervised and unsupervised statistical tools is the covariance matrix C (or the normalized covariance matrix, resulting in a correlation matrix) of the metabolite concentrations (for in-depth analysis of the covariance/correlation matrix of metabolite concentrations, see [20–22, 58, 59]). For the systematic connection between C and the stoichiometric matrix of a genome-scale network, see “A systematic genotype–phenotype equation: connecting metabolomics covariance data (C) and genome-scale metabolic network reconstruction (N)”

