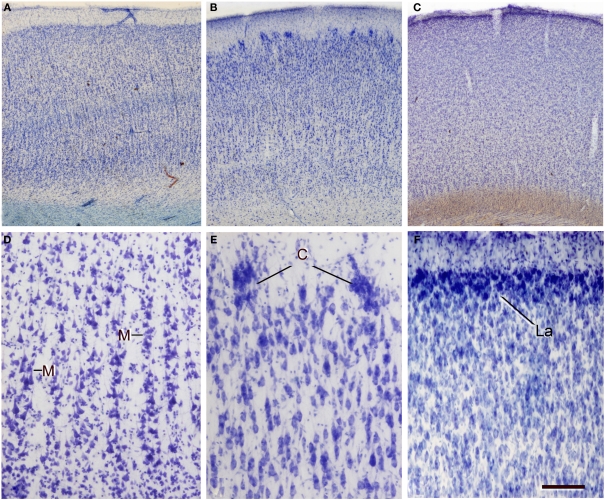
Figure 11.
Variations in neuron density, cytoarchitectonic organization, and in the size and distribution of vertical neuron aggregates. (A–C) Low-power photomicrographs of 100-μm thick vibratome sections stained with thionin from (A) Brodmann's area 21 of the human, (B) the occipital cortex of the giraffe, and (C) the bill representation in the primary somatosensory cortex of the platypus. (D–F) High-power images showing some clear cytoarchitectonic differences between the three species: (D) presence of vertical aggregates of neurons or minicolumns (M) in layers II–III of the human area 39; (E) clusters of neurons (C) in layer II of the giraffe; (F) highly cellular dense layer II (La) in the platypus. Note the obvious differences in the density of cells between the three species. Scale bar in (F): 710 μm in (A–C); 100 μm in (D–F).

