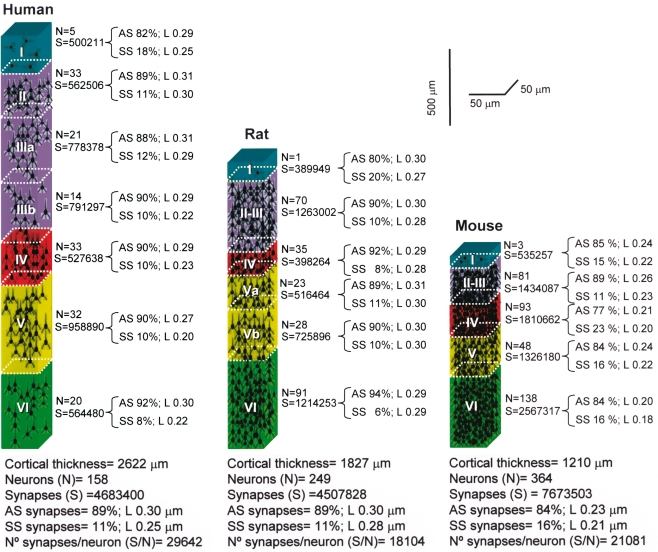
Figure 13.
Cortical microanatomical variations between humans, rats, and mice. Comparison of the thickness of layers, number of neurons and of the synaptic profiles within cubes of cortical tissue (50 μm wide by 50 μm thick) from the pial surface to the white matter in the human (anterolateral temporal cortex; T2–T3), rat (hindlimb area of the somatosensory cortex), and mouse (barrel cortex). L, cross-sectional length of synaptic junctions; AS, asymmetric synapses; SS, symmetric synapses. Values taken from DeFelipe et al. (2002).

