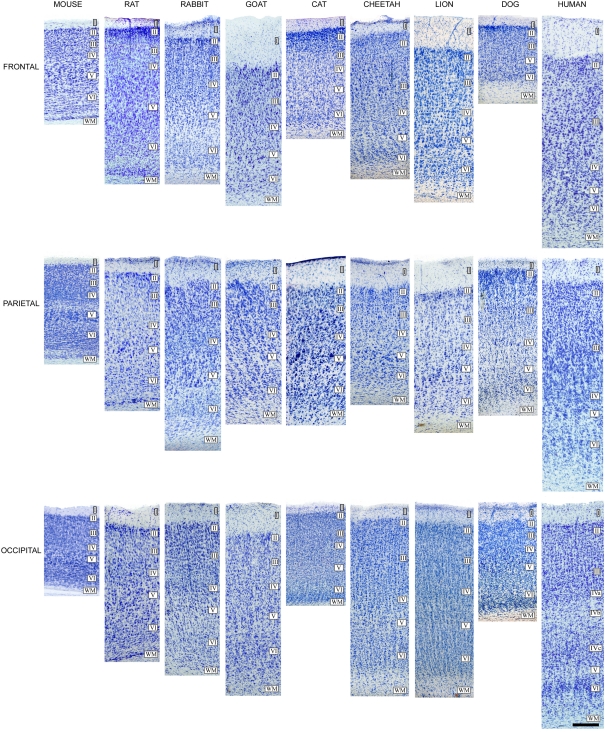
Figure 8.
Cytoarchitectonic differences in the mammalian cortex. Photomicrographs from 100 μm thick Nissl-stained sections showing some cytoarchitectonic differences between frontal, parietal, and occipital cortical areas of the human (areas 10, 3b, and 17, respectively) and several mammals. Scale bar: 250 μm. Adapted from Ballesteros-Yánez et al. (2005).

