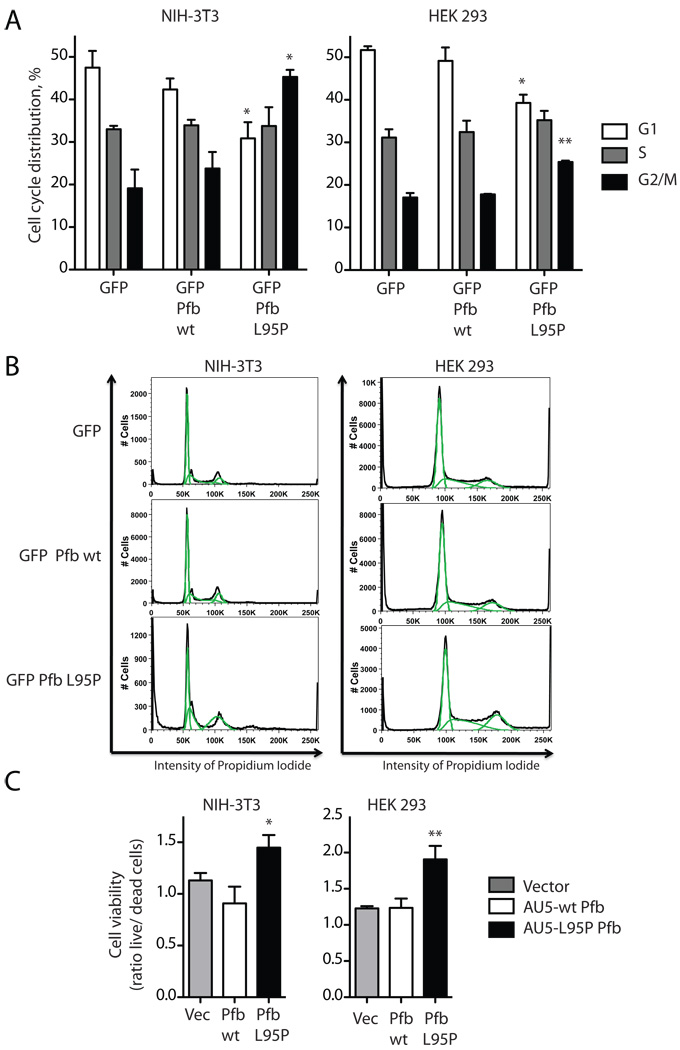
Figure 5. The L95P parafibromin mutant enhances cell cycle progression and promotes cell survival in vitro.
A. Cell cycle analysis. NIH-3T3 cells and HEK 293 cells were transfected with GFP vector cDNA control or else cDNAs encoding fusion proteins of GFP with wild-type (wt) or L95 mutant parafibromin (Pfb). After 48 hours of transfection the cells were subjected to flowcytometric analysis in GFP expressing cells. Histograms show the percentage of cells in the indicated phases of the cell cycle. Values shown represent mean and standard errors of pooled results from of (HEK 293) or 3 (NIH-3T3) independent experiments; **, two-tailed P value <0.02; * <0.05 compared to GFP control, employing Student’s unpaired t test. B. Flowcytometric analysis plotting cell number versus intensity of propidium iodide signal for cells transfected under the indicated conditions, from a representative experiment described in A. C. Cell viability analysis. Cultured NIH-3T3 cells and HEK 293 cells were transfected with vector only (Vec), or AU5 epitope-tagged wild-type (wt) or L95P mutant parafibromin (Pfb) and after 48 hrs were analyzed for cell viability as described in Experimental Procedures. Ordinate values show the ratio of live to dead cells, representing the pooled data of six independent repeats. *, two-tailed P value <0.05; ** <0.01 compared to vector and wild-type controls, employing Fisher’s exact test.

