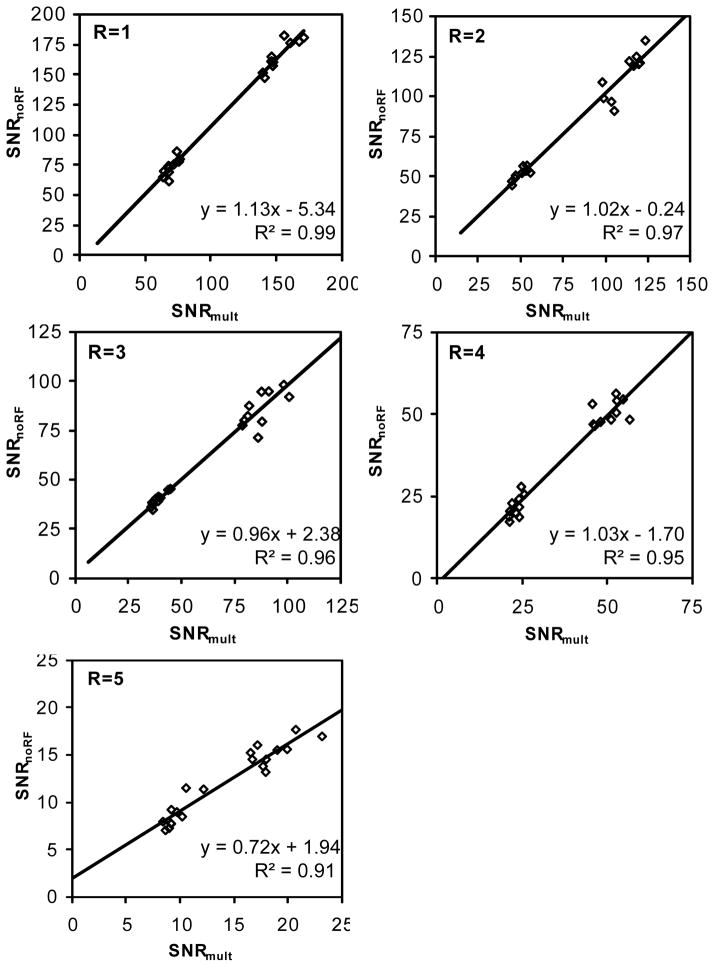
Fig 6.
Scatter plot of SNRmult vs. SNRnoRF measured in the phantom study at different SENSE acceleration factors. SNRmult and SNRnoRF were measured in five pixels within the phantom (Fig 2b). The least squares fit of linear functions and the corresponding R2 are shown on the scatter plot. Each plot has its axis scales adjusted to SNR ranges at individual SENSE acceleration factors.

