Figure 1.
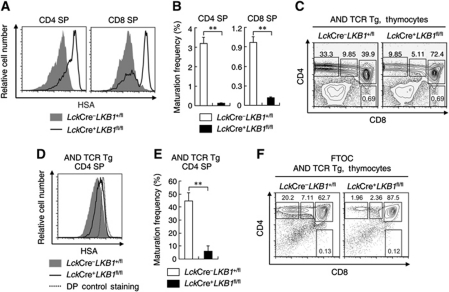
LKB1-deficient mice fail to generate mature CD4 and CD8 SP thymocytes. (A) Histograms showing the surface expression of HSA on CD4 and CD8 SP thymocytes from LckCre+LKB1fl/fl mice or littermate controls. (B) Maturation frequencies of CD4 and CD8 SP thymocytes from LckCre+LKB1fl/fl mice or littermate controls were calculated as the number of HSAlow CD4 SP and CD8 SP thymocytes relative to the number of DP thymocytes. Absolute cell numbers of HSAlowCD4 SP, HSAlowCD8 SP, and DP thymocytes were calculated by multiplying total live cell numbers by the fraction of cells in that population. Data are expressed as mean±s.e.m. (n=3) **P<0.01 (Student's t-test). (C) Total thymocytes of AND transgenic LckCre–LKB1+/fl mice or LckCre+LKB1fl/fl mice were analysed for CD4 and CD8 expression by flow cytometry. Numbers next to or within boxes of the respective contour diagrams indicate the percentage of cells examined. (D) Histogram showing surface expression of HSA on AND transgenic LckCre–LKB1+/fl or LckCre+LKB1fl/fl CD4 SP thymocytes. The expression of HSA on AND TCR transgenic LKB1-deficient DP cells was used as control. (E) Maturation frequency of CD4 SP thymocytes from AND transgenic LckCre–LKB1+/fl mice or LckCre+LKB1fl/fl mice was calculated as described above. Data are expressed as mean±s.e.m. (n=4). **P<0.01 (Student's t-test). (F) Fetal thymic lobes were obtained and cultured 6 days for flow cytometric analysis. Harvested thymocytes were stained with anti-CD4, anti-CD8, and propidium iodide for developmental profile analysis. Results are representative of two (F), three (A, B), or four (C, D, E) independent experiments.

