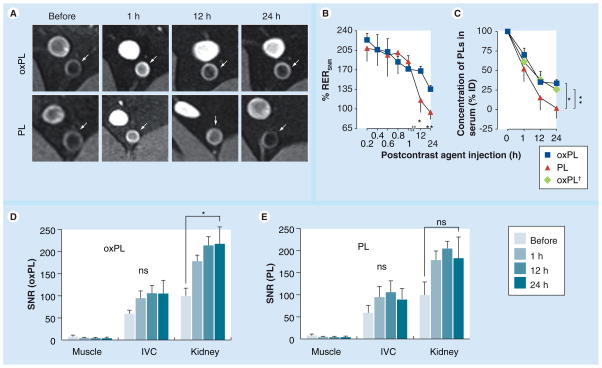
Figure 4. In vivo testing of the vesicles.
(A) T1-weighted MR images of atherosclerotic abdominal aorta after oxPL or PL administration. Signal enhancement in plaque (white arrows) was seen over a 24-h period with oxPL but not PL. (B) Time course of MR signal enhancement. The difference in enhancement between pre- and post-contrast injection is presented as relative enhancement ratio The amount of gadolinium in serum was quantified over time using inductively coupled plasma mass spectrometry for (RERSNR). (C) oxPL- and PL-injected animals (n = 5 and n = 3, respectively). Cholesterol-9-carboxynonanoate concentration in serum was determined by LC-MS for oxPL-injected rabbits (n = 5, oxPL† plot). Concentration of PL in serum is presented as percentage of dose injected. (D & E) Analysis of SNR (oxPL and PL, respectively) in the muscle, IVC and kidney. *p < 0.05; **p < 0.001.
IVC: Inferior vena cava; ns: Not significant; oxPL: Cholesteryl-9-carboxynonanoate phospholipid vesicles; PL: Phospholipid; RER: Relative enhancement ratio; SNR: Signal to noise ratio.

