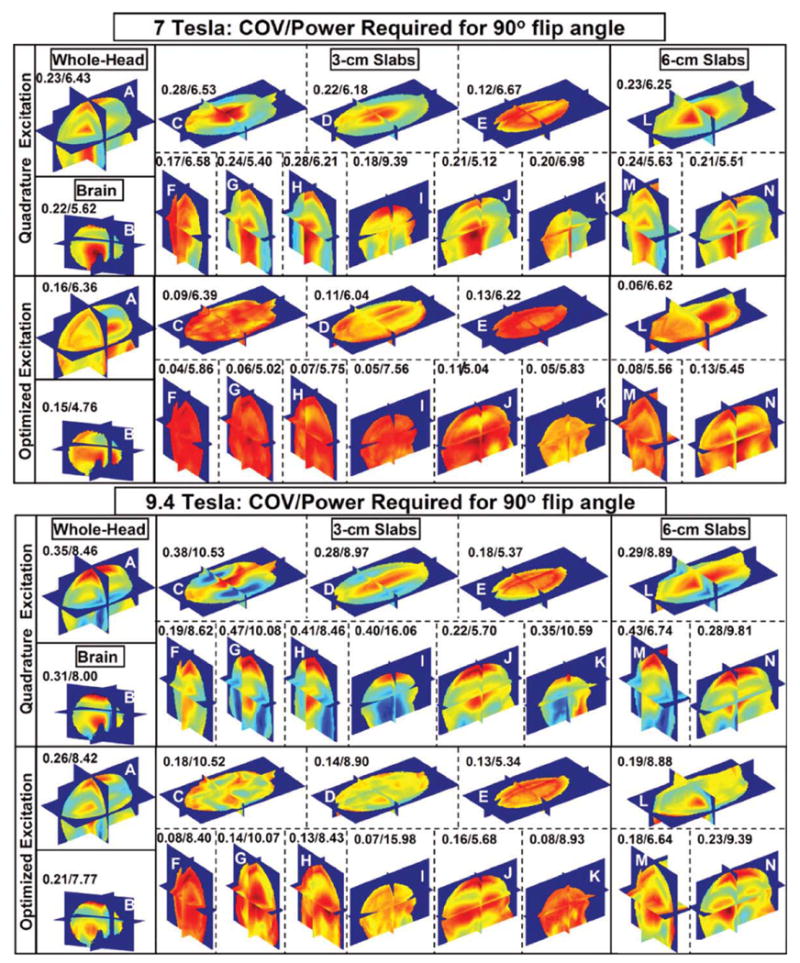
Figure 4.

Normalized field distributions calculated using the FDTD model at 7 and 9.4 T. The 14 subfigures represent the distributions for whole head, brain, 3-cm slabs, and 6-cm slabs (all labeled in Table 2) under 16-port, quadrature and optimized ( shimming) excitations. The results are presented for an 18-tissue human head model numerically loaded in a 16-element TEM coil (numerically tuned to ∼300 and 400 MHz) and operating as a transmit array. The homogeneity of field distribution in each region of interest was optimized to achieve minimum coefficient of variance while maintaining or reducing the total (over the whole head) RF power deposition (obtained with quadrature excitation.) The letter on each subfigure represents the label of the optimized region of interest as shown in Table 2. The numbers above each subfigure represent the values of the coefficient of variance/absorbed power, where the absorbed power in each case is scaled to achieve a mean field intensity of 1.957 μT in the volume of any ROI.
