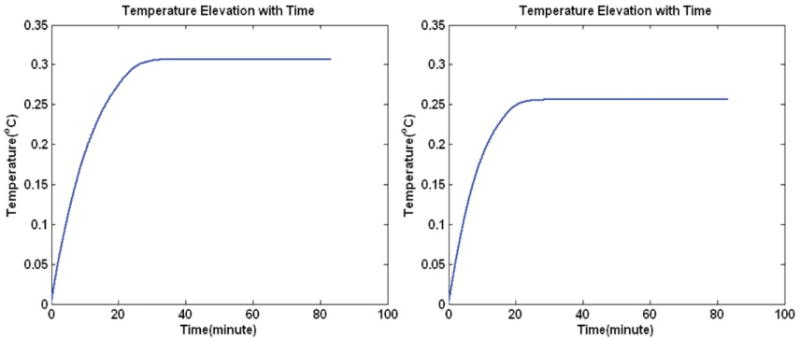
Figure 8.

Temperature elevation (DT) changes with time for 7 T MRI. The left subplot is the increased temperature at the position where peak DT is located using quadrature excitation condition, and the right subplot is the peak DT under shimming aimed at minimizing the COV of the field distribution in the brain.
