
Figure 2.
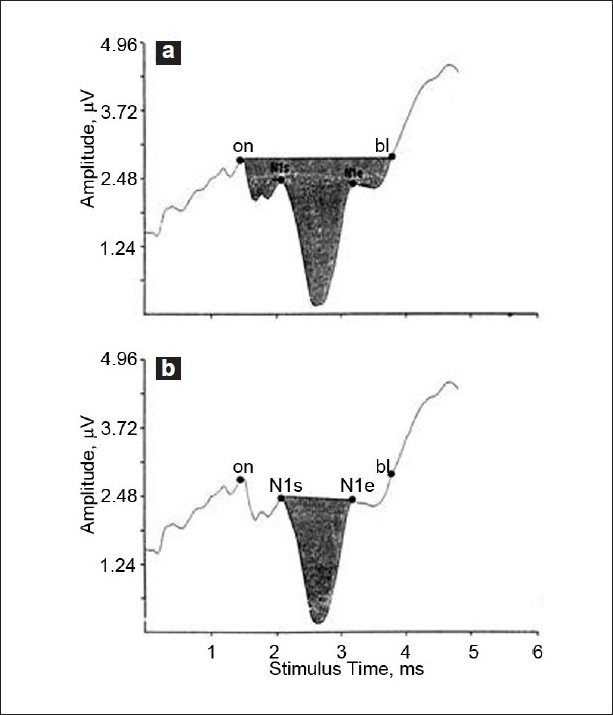
ECoCG tracing for summating potential (SP/AP) area ratios. Stimulus onset (on), start of N1 deflection (N1s), end of N1deflection (N1e) and baseline return (bl) are marked. (a) Software subroutines calculate the ratio of SP area (from on to bl). (b) AP area (from N1s to N1e) is determined by similar subroutines (Devaiah AK, Dawson KL, Ferraro JA, Ator GA. Utility of area curve ratio electrocochleography in early Meniere’s disease. Arch Otolaryngol Head Neck Surg 2003;129:547-51)