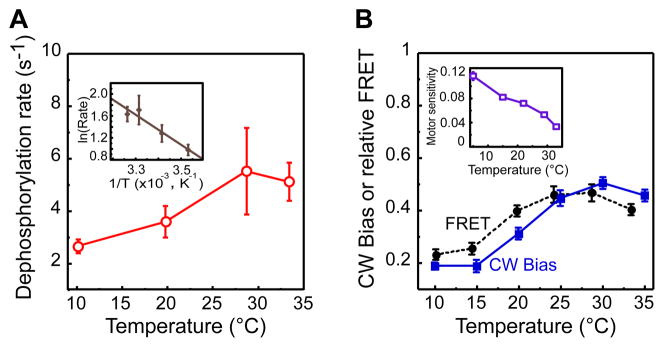
Figure 3. Temperature Effects on CheY Dephosphorylation Rate and on the Pathway Output.
(A) Temperature dependence of CheY-P dephosphorylation rate. Dephosphorylation rate was determined by fitting kinetics of the FRET decay in VH1 [pVS123/pVS88] cells upon rapid stimulation with 1 mM asparate. Inset Arrhenius plot of the same data and the corresponding linear fit. (B) Adapted FRET level (black circles, scaled by 10−1 compared to units used in Figure 2) and CW motor bias (blue squares) taken from (Paster and Ryu, 2008) as functions of temperature for wild-type cells. Inset Temperature dependence of motor sensitivity, defined as the inverse of the concentration of a constitutively active mutant CheY** that produces a CW motor bias of 0.5, based on published data (Turner et al., 1999). Units of motor sensitivity are μM−1. See also Figure S2.

