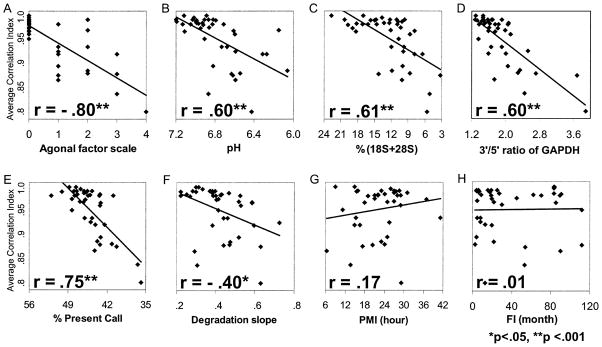
Figure 2.
Agonal factors and ribonucleic acid (RNA) degradation decrease Average Correlation Index (ACI). The ACI was calculated for the anterior cingulate cortex for 40 subjects and plotted on the y axis in the eight dot plots (A–H). The x axis shows the corresponding (A) agonal factor score (AFS); (B) brain tissue pH; (C) percentage of 18S and 28S ribosomal RNA to total RNA [%(18S+28S)]; (D) ratio of signal intensities for probe sets designed in 3′ and 5′ end region of glyceraldehyde phosphate dehydrogenase (GAPDH) gene (3′/5′ ratio of GAPDH; (E) the percentage of the total number of probe sets detected as present on the array (% Present Call); (F) coefficient of the RNA degradation slope from 5′ to 3′ ends of the averaged probe intensities calculated with the R-statistical program AffyRNAdeg (Degradation slope); (G) postmortem interval (PMI); and (H) freezer interval (FI). Average Correlation Index was significantly correlated with AFS and all of the RNA integrity indicators analyzed, whereas ACI showed no correlation with PMI and FI.

