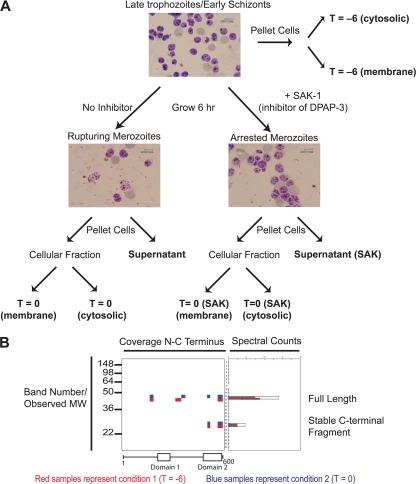
Fig. 1.
PROTOMAP analysis of parasites rupturing from host red blood cells. A, experimental setup used to generate samples for analysis by PROTOMAP. Synchronously grown parasites were isolated in the late trophozoite/early schizont stage (approximately 42 h postinfection). Samples for analysis (bold labels) were prepared as indicated. Representative stained blood smears are shown to indicate parasite morphology at each sample point. Final parasite or supernatant samples were subjected to SDS-PAGE, and each lane was excised into 26 slices followed by analysis by LC-MS/MS. B, representative peptograph generated from the data set collected from the samples in A. Peptides (colored bars) are mapped to the location on the protein sequence (top of gel image). Approximate molecular weight (MW) positions are shown at left, and total spectral counts for each peptide are shown at right. The colors are used to compare data obtained for this protein in each of two samples. In this case, peptides identified in the T = −6 are shown in red, and peptides identified in the T = 0 sample are shown in blue. A conserved domain map based on published predictions is shown at the bottom of the peptograph (21, 22). Spectral count data error bars are standard error of the mean.

