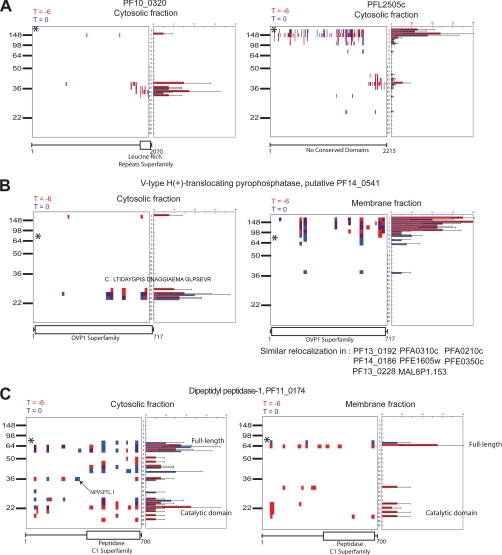
Fig. 6.
Mining PROTOMAP data set for additional biologically relevant data. A, peptographs of two proteins comparing T = 0 (blue) with T = −6 (red) samples to demonstrate constitutive processing to produce two stable fragments. B, peptographs comparing T = 0 (blue) with T = −6 (red) for both membrane and cytosolic samples, demonstrating a time-independent processing event that results in conversion of a full-length membrane-bound protein to a cytosolic peptide fragment. C, peptographs from the cytosolic fraction showing greater processing of DPAP1 at T = −6 compared with T = 0. * identifies the predicted size of full-length proteins (PF10_0320, 246.7 kDa; PFL2505c, 263.1 kDa; PF14_0541, 76.4 kDa; PF11_0174, 80.4 kDa).

