
Fig. 1. .
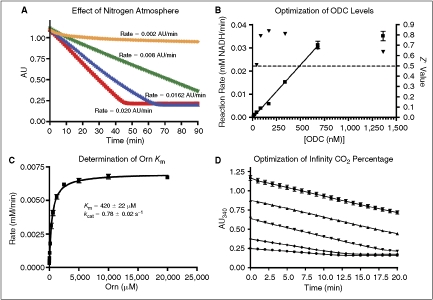
Optimization of assay conditions. (A) Increase in background signal under normal atmosphere. The signal seen here in green is solely from atmospheric CO2 (orange = nitrogen atmosphere, no ornithine; green = standard atmosphere, no ornithine; blue = nitrogen atmosphere, 625 μM ornithine; red = standard atmosphere, 625 μM ornithine). Quadruplicate data were collected in a 384-well microplate as described in the presence of the indicated concentrations of ornithine. All other reagent concentrations were identical to the optimized conditions described in Materials and Methods. The nitrogen atmosphere was maintained as described with O2 levels under 2.5%. (B) Optimization of enzyme levels. ▾ = Z′ values,  = reaction rates. Dashed line indicates standard Z′ cutoff value of 0.5. Data were collected in a 384-well microplate using optimized assay conditions with varied final ornithine decarboxylase (ODC) concentrations. Z′ Values were calculated using 8 positive (1 mM difluoromethylornithine (DFMO)) and 8 negative (DMSO) controls. The signal window at 150 nM ODC is ∼5-fold. (C) Determination of ODC Km at 150 nM ODC and 60 μM PLP. Data were collected in a 384-well plate as described and fit to the Michaelis–Menten equation. (D) Optimization of Infinity CO2 percentage ( = 60% Infinity CO2, ▴ = 45% Infinity CO2, ▾ = 30% Infinity CO2, ♦ = 15% Infinity CO2, • = 7.5% Infinity CO2). Data were collected in 384-well plates as described at optimized assay conditions with varied Infinity CO2. Data points were taken every 15 s in quadruplicate. The plot of AU340 vs. time at 60% Infinity CO2 represents a typical data set under optimized assay conditions with a ΔAU340 of ∼0.4 AU.