Fig. 2. .

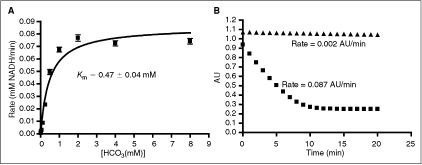
Optimization of PEPC-MDH assay system. Data were collected under nitrogen as described in Materials and Methods. All data were collected under nitrogen in 384-well microplates. (A) Determination of the Km apparent with respect to bicarbonate. The value obtained is consistent with literature values.24,25 Data were fit to the Michaelis–Menten equation. (B) Determination of assay linear time ( = 0.75 mM HCO3, ▴ = no HCO3). Under optimized assay conditions, the bicarbonate signal was linear for ∼7 min.
