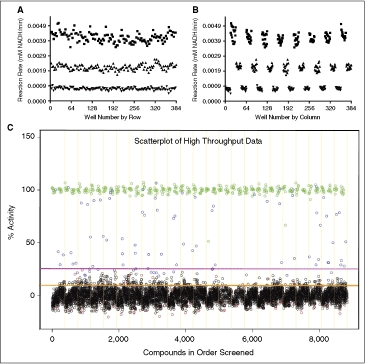
Fig. 4. .

ODC-PEPC-MDH-linked plate geographic effects and high-throughput data scatter plot. Assays were performed in 384-well plates as described and rates were calculated from the final 6 data points from a 20-min observation.  = High signal (DMSO), ▴ = mid signal (200 μM difluoromethylornithine (DFMO)), ▾ = low signal (1 mM DFMO). (A) Column effects resulting in a slight increase in signal on the outer columns. (B) Data from 3A arranged by row, showing that signal across rows is constant. The signal window for the assay is also apparent in these figures and is ∼4.5. (C) Data from the small-scale high-throughput assay of the bioactive compound collection at St. Jude Children’s Research Hospital. Green circles = positive control (1 mM DFMO), red circles = negative control (DMSO), blue circles = hit compound, black circles = inactive compound. Magenta line = 99th percentile cutoff, orange line = 95th percentile cutoff. Percent activity was calculated by normalizing kinetic reaction rates (20-min data collection with the final 6 data points fit as described in Materials and Methods) to positive and negative controls. The 8,832 total data points were collected from ∼3,600 unique compounds. Absolute replicate number for each compound varied from 1 to 7, depending on vendor library composition and plating. The assay took 8.7 h to complete using our automation system.
