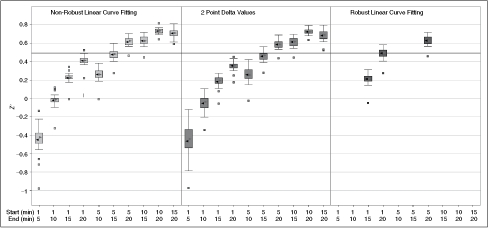
Fig. 5. .

Effect of varying curve fitting methods on average Z′ values for scaling screen. ▸ = Median, ◂ = mean, solid line = standard Z′ cutoff of 0.5. Data were collected as described in Materials and Methods under optimized assay conditions. Time points were taken every minute for 20 min. Note that the first 5 to 10 min are poorly behaved and that eliminating them dramatically increases the average Z′ for the run. This is primarily a result of a decrease in scatter rather than an increase in signal, since the average rates calculated were consistent for all methods tested.
