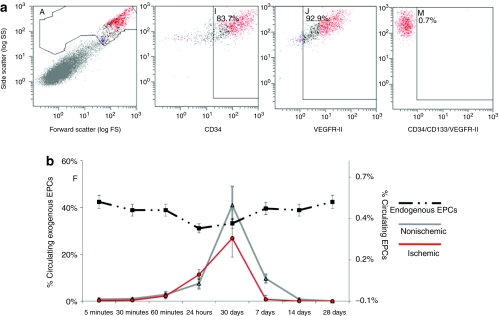
Figure 1.
In vivo exogenous and endogenous endothelial progenitor cell (EPC) tracking by fluorescence-activated cell sorting (FACS) analysis in control and ischemic animals. (a) FACS plots showing the cell population and marker positivity. (b) Data (mean ± SD) on in vivo exogenous and endogenous EPC tracking by FACS. Peak exogenous EPC circulation (solid lines—left axis) occurred between 1 and 7 days with maximal circulation at day 3 in both control and ischemic groups. The dashed line—right axis represents endogenous EPCs. Endogenous EPC levels remained stable throughout the time course of the study.

