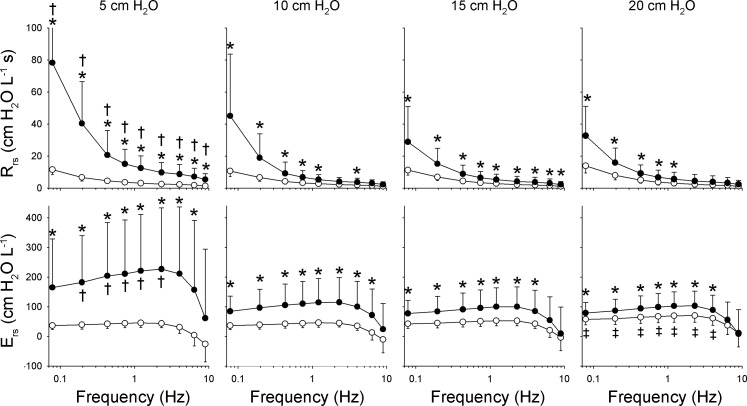
Fig. 1.
Summary of respiratory resistance (Rrs) and elastance (Ers) vs. frequency at baseline (○) and following lung injury (●) at 4 different mean airway pressures. Values are presented as means ± SD. *Significantly higher than baseline data at same frequency and airway pressure. †Significantly higher than corresponding data at 10, 15, and 20 cmH2O at same condition and frequency. ‡Significantly higher than corresponding data at 5, 10, and 15 cmH2O at same condition and frequency using analysis of variance and least significant difference criterion. [Modified from Kaczka et al. (46) with permission. Copyright Wolters Kluwer Health.]

