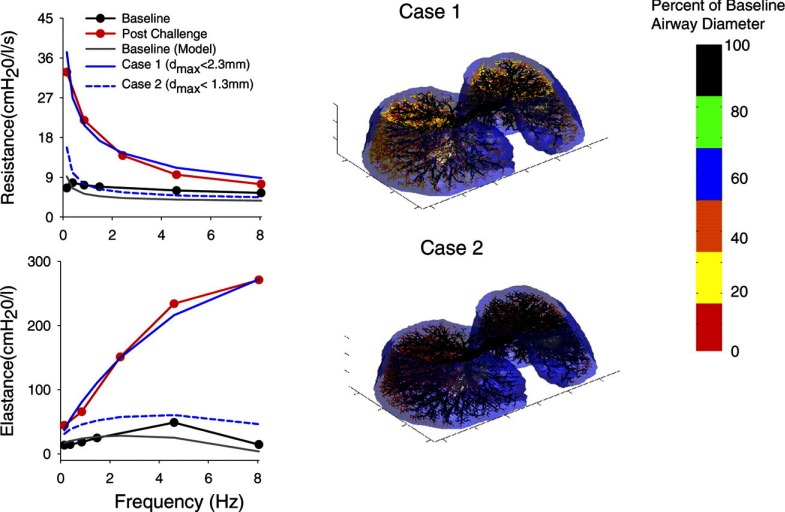
Fig. 3.
Left: lung resistance and elastance vs. frequency for an asthmatic subject at baseline (black circles) and following inhaled methacholine challenge (red circles). Baseline data are shown with prediction based on the 3-dimensional (3D), asymmetric 26-generation model of Tawhai et al. (83) (gray). Postchallenge data are shown with 2 different predictions from the model (blue lines), consistent with ventilation defects observed with PET imaging. Solid blue line (case 1) is model prediction when constrictions are confined to generations 14 and below (diameter < 2.3 mm), whereas dashed blue line (case 2) is model prediction with airway constrictions confined to generations 16 and below (diameter < 1.3 mm). Right: 3D surface rendering of the model airway tree superimposed inside the pleural surface for the 2 postchallenge conditions. Each airway segment of the model within the pleural surface is color coded (bar) to represent the degree of airway constriction as a percentage of maximum diameter (dmax). These data illustrate that constriction of small airways (i.e., with diameters between 1.3 and 2.3 mm) are required to mimic the observed changes in resistance and elastance during bronchoprovocation. [Modified from Tgavalekos et al. (85) with permission.]

