
Figure 5. Overall patterns of mutation and ageing.
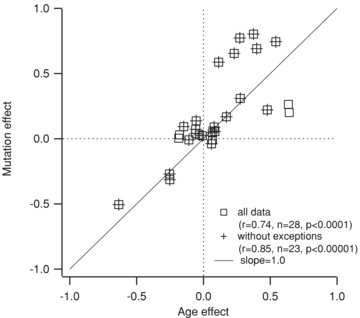
The y-axis is the average difference in an electrical property induced by the SOD1 mutation, normalized by the average of values from all cells (all ages, both WT and SOD1). The x-axis is the averaged normalized difference for age, such that if a property were showing a 40% increase with both age and mutation it would fall precisely on the slope = 1 line at (0.4, 0.4). For all data, r2= 0.548, n = 28, P < 0.0001; and without exceptions, r2= 0.723, n = 23, P < 0.00001.