
Figure 6. More pronounced SOD1 phenotype of the AP and AHP in a subset of SOD1 neurons.
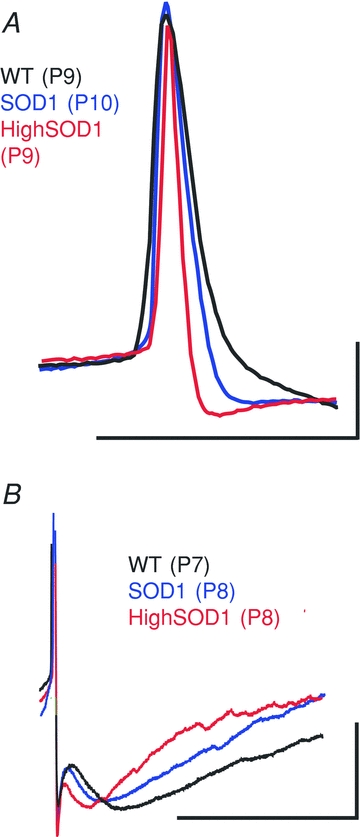
A, the APs in the high-PIC SOD1 group were significantly shorter in duration than the rest of the SOD1 group. B, the time constant of the medium AHP decreased more drastically in the high-PIC SOD1 group, shortening the duration of the AHP. Scale bars: A horizontal, 0.1 s; A vertical, 20 mV; B horizontal, 0.1 s; B vertical, 20 mV.