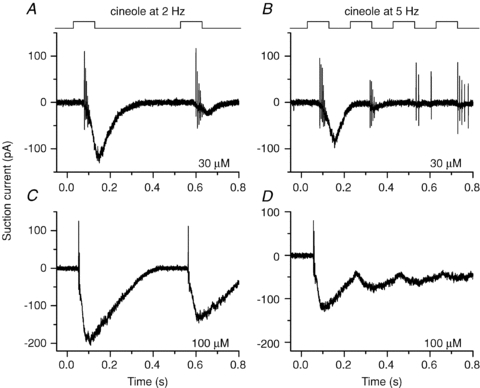
Figure 2. Changes in action potential patterns with increased stimulation frequency and odorant concentration.

Beginning of the same recordings as in Fig. 1, on an expanded time scale to resolve individual action potentials.

Beginning of the same recordings as in Fig. 1, on an expanded time scale to resolve individual action potentials.